
Newly adjusted figures reveal the average total household debt stands at approximately $147,919 nationwide. However, debt levels vary significantly across the United States, with notable disparities at both the geographical and generational level. These differences can highlight how certain areas grapple with higher debts, while others may have higher flows of disposable income. Additionally, the age of residents in different areas could affect their sources of financial stress and flexibility.
With this in mind, SmartAsset adjusted the latest debt breakdowns by region and age group to December 2024 dollars to understand the financial bottlenecks different American cohorts are facing. It also ranked states based on the percentage of households that have a negative net worth after accounting for all their assets and debts.
Key Findings
SmartAsset
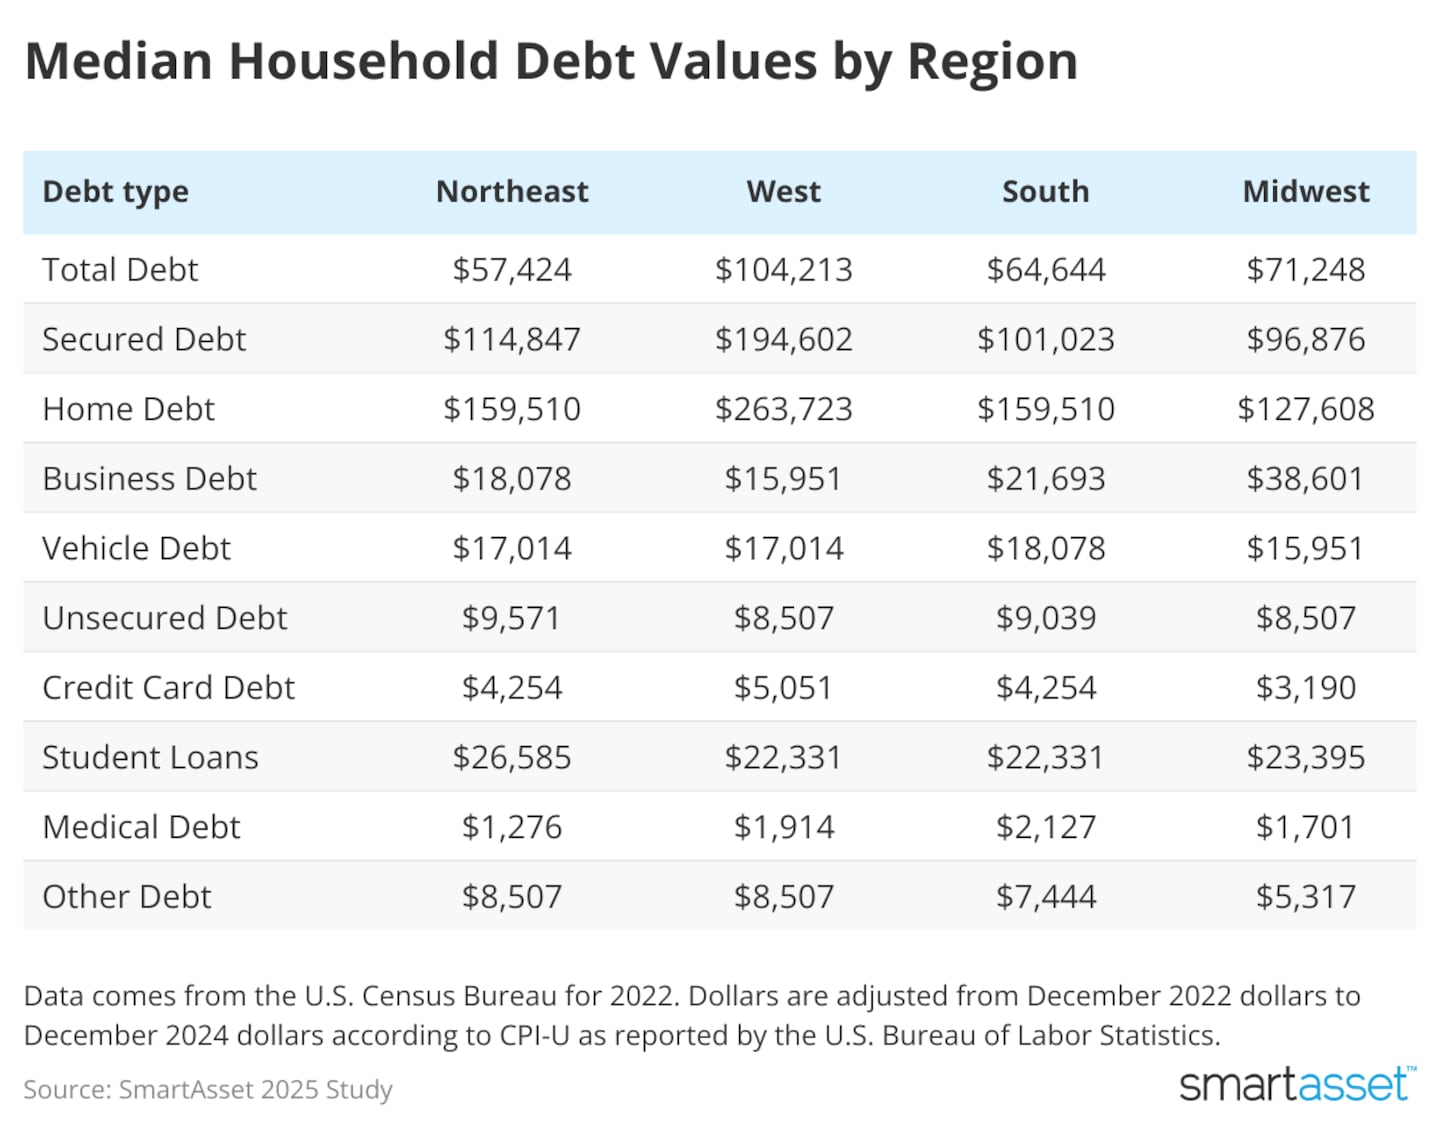
Regional Debt Disparities
- The West leads in total debt. Households in the West hold the highest average of total debt, just over $104,200. The Midwest follows with households owing $71,247 on average. Midwestern households also have the largest average business debt at $38,601.
- Home debt is a primary driver of regional variations. Households in the West report average home debt of $263,723—substantially above other regions, where home-related debt ranges from $127,000 to $160,000.
SmartAsset
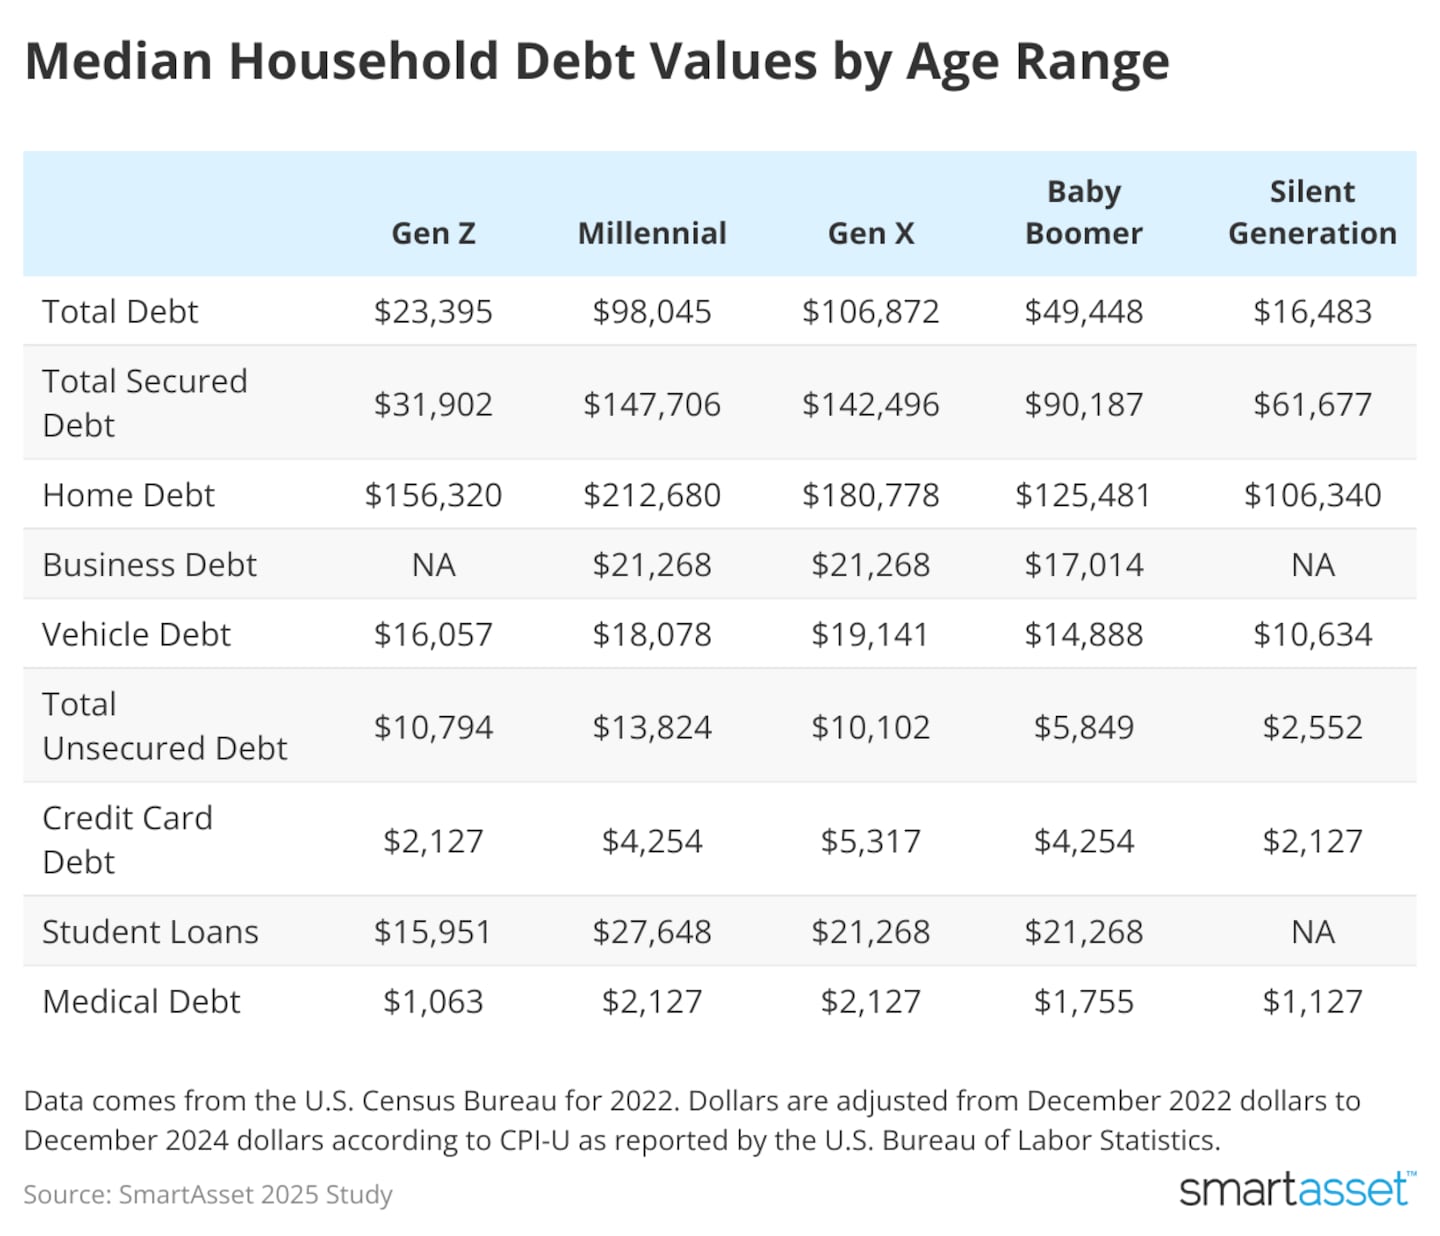
Debt by Generation
- Millennials hold the most student loan debt. With an adjusted average of $27,648 in student loans, this age group has the highest student loan debt per person.
- Gen X carries the highest total debt. Those in their mid-40s through 50s hold the largest overall debt burden, averaging nearly $107,000. Meanwhile, Baby Boomers average less than half that at an average of $49,448.
SmartAsset
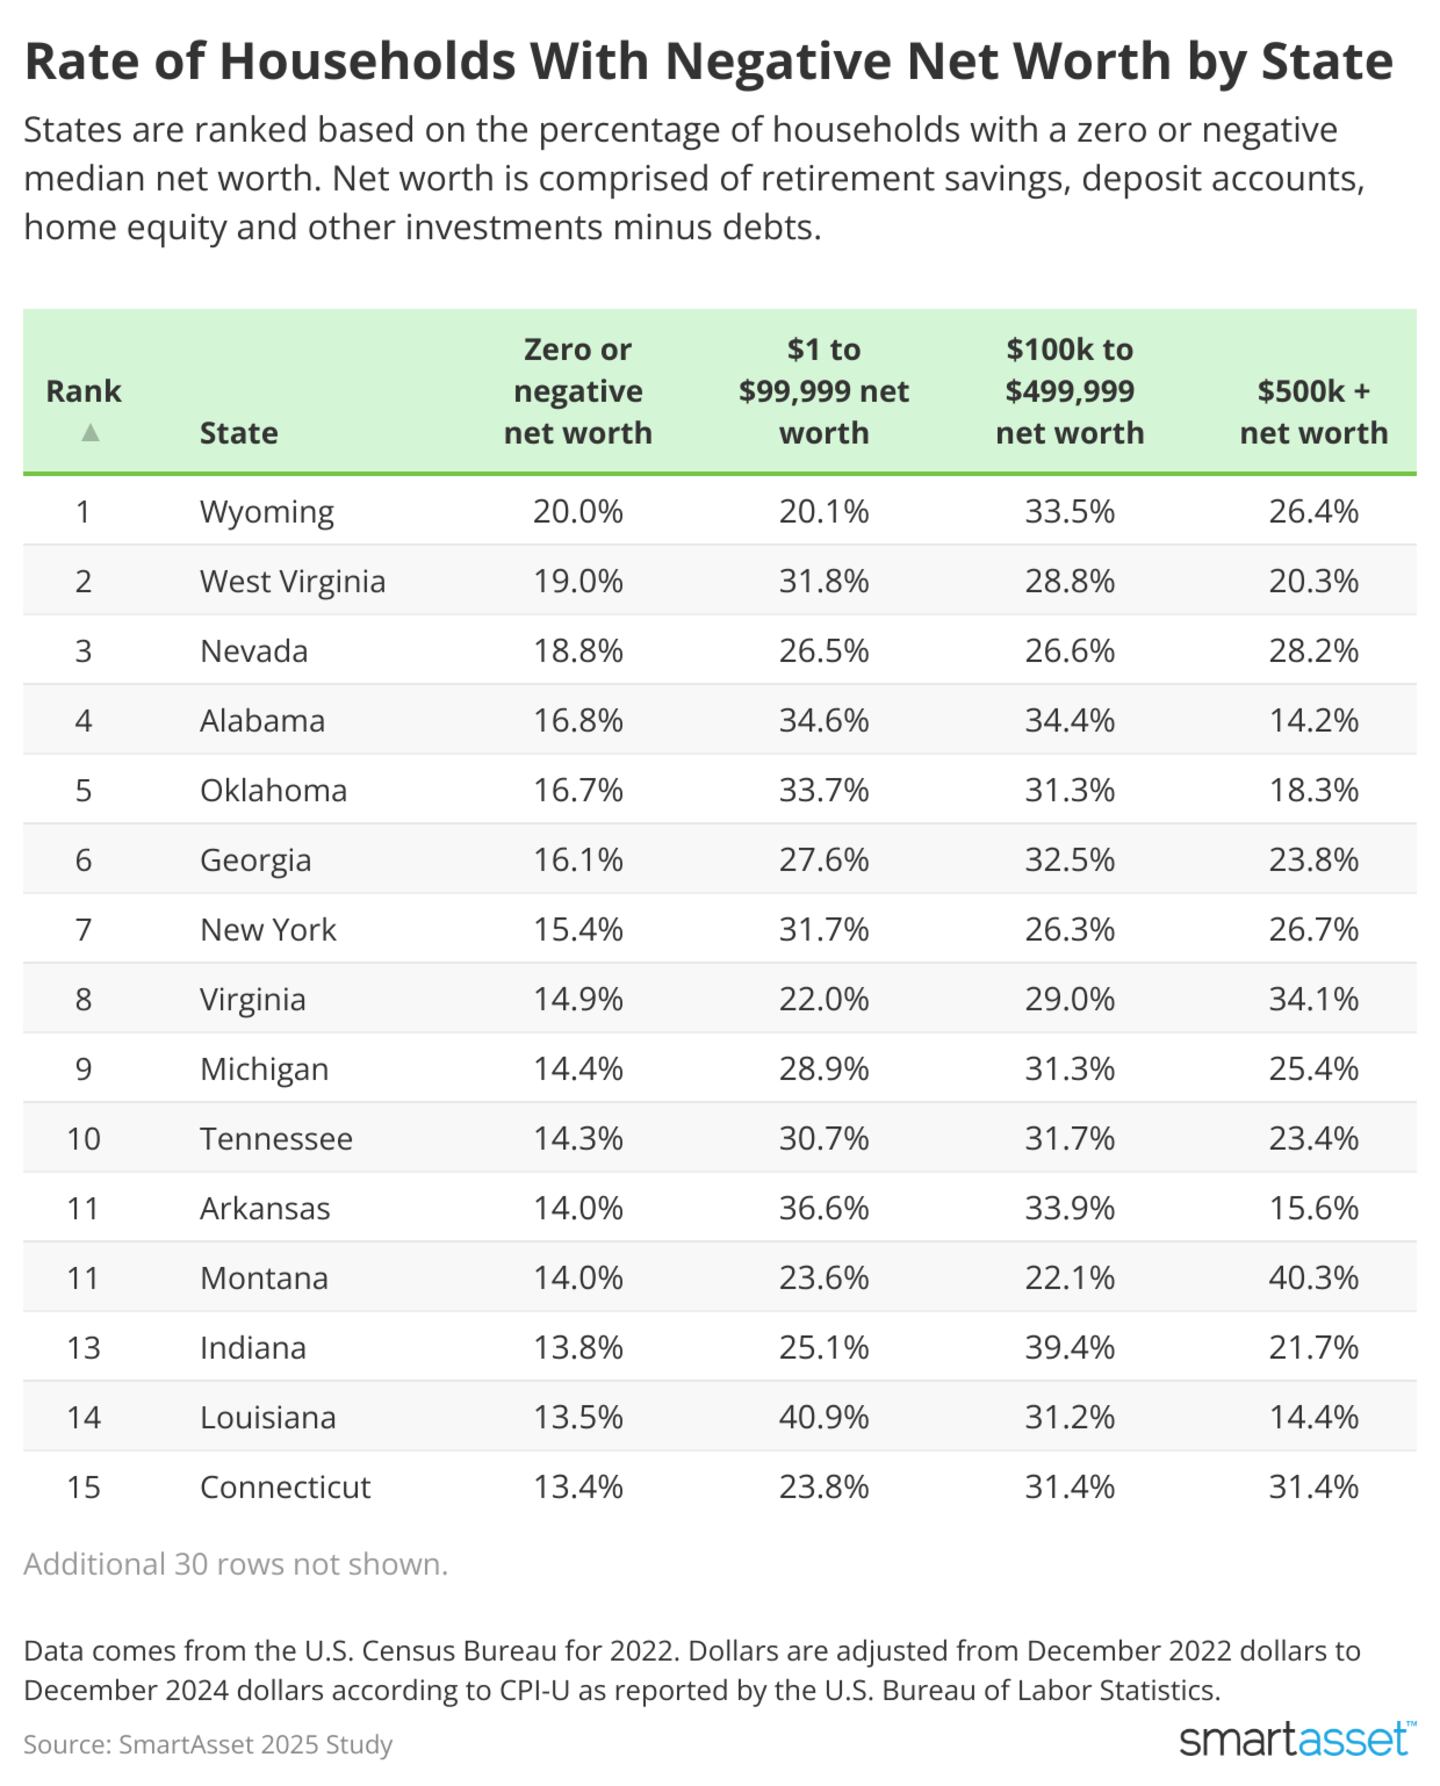
Net Worth by State
- On average, 11.1% of households across the U.S. have a zero or negative net worth. On the opposite end of the spectrum, an average of 30.3% of U.S. households have a net worth between $100k and $499,999, with another 29.2% having a net worth of $500k or more.
- Wyoming has the highest percentage of households with zero or negative net worth (20%). The Cowboy State also has a relatively high percentage of households with $500K+ in net worth (26.4%). This suggests a strong disparity in wealth.
- These two states have the highest rates of households with low net worth. Almost one-quarter of Louisiana households (22.4%) and 22.1% of Mississippi households (22.1%) are worth between $1 and $25k when accounting for assets and liabilities.
Top 10 States With the Most Households With a Negative Net Worth
Debt outpaces assets in the highest proportion of households in these states.
- Households with zero or negative net worth: 20%
- Households with $1 - $24,999 net worth: 14.9%
- Households with $25k - $99k net worth: 5.2%
- Households with $100k to $499k net worth: 33.5%
- Households with $500k+ net worth: 26.4%
- Households with zero or negative net worth: 19%
- Households with $1 - $24,999 net worth: 16.7%
- Households with $25k - $99k net worth: 15.1%
- Households with $100k to $499k net worth: 28.8%
- Households with $500k+ net worth: 20.3%
- Households with zero or negative net worth: 18.8%
- Households with $1 - $24,999 net worth: 18.6%
- Households with $25k - $99k net worth: 7.9%
- Households with $100k to $499k net worth: 26.6%
- Households with $500k+ net worth: 28.2%
- Households with zero or negative net worth: 16.8%
- Households with $1 - $24,999 net worth: 19.2%
- Households with $25k - $99k net worth: 15.4%
- Households with $100k to $499k net worth: 34.4%
- Households with $500k+ net worth: 14.2%
- Households with zero or negative net worth: 16.7%
- Households with $1 - $24,999 net worth: 14.9%
- Households with $25k - $99k net worth: 18.8%
- Households with $100k to $499k net worth: 31.3%
- Households with $500k+ net worth: 18.3%
- Households with zero or negative net worth: 16.1%
- Households with $1 - $24,999 net worth: 15.5%
- Households with $25k - $99k net worth: 12.1%
- Households with $100k to $499k net worth: 32.5%
- Households with $500k+ net worth: 23.8%
- Households with zero or negative net worth: 15.4%
- Households with $1 - $24,999 net worth: 19.3%
- Households with $25k - $99k net worth: 12.4%
- Households with $100k to $499k net worth: 26.3%
- Households with $500k+ net worth: 26.7%
- Households with zero or negative net worth: 14.9%
- Households with $1 - $24,999 net worth: 9.6%
- Households with $25k - $99k net worth: 12.4%
- Households with $100k to $499k net worth: 29%
- Households with $500k+ net worth: 34.1%
- Households with zero or negative net worth: 14.4%
- Households with $1 - $24,999 net worth: 13.8%
- Households with $25k - $99k net worth: 15.1%
- Households with $100k to $499k net worth: 31.3%
- Households with $500k+ net worth: 25.4%
- Households with zero or negative net worth: 14.3%
- Households with $1 - $24,999 net worth: 16%
- Households with $25k - $99k net worth: 14.7%
- Households with $100k to $499k net worth: 31.7%
- Households with $500k+ net worth: 23.4%
Data and Methodology
Household debt and net worth data comes from the U.S. Census Bureau for 2022. A cumulative 6.34% inflation rate (CPI-U) between December 2022 and December 2024 was applied to figures to translate estimates to December 2024 dollars. Data was available for 44 states (Alaska, Delaware, New Hampshire, North Dakota, South Dakota and Vermont were excluded).
This story was produced by SmartAsset and reviewed and distributed by Stacker.
/cloudfront-us-east-1.images.arcpublishing.com/cmg/XCUXZC2XYZHCRGNNGKFEX6U3LQ.png)


